http://d-edreckoning.blogspot.com/2008/03/data-shows-you-are-wrong.html
This weekend I discovered that S&P's School Data Direct makes all their school data available for download. This represents a cornucopia of school related data we can play with.
Of course, they make it as difficult as they possibly can to use that data, but where there's a will there's a way.
All this week I want to take a look at the performance of economically disadvantaged students and see what the data tells us. Let's see if the various bromides and theories we've been debating for the last few weeks find some support in the data.
I'm going to use the dataset for Pennsylvania 2005. It's not the most recent dataset (that would be 2007), but it is the latest dataset that includes financial and demographic data. I found data for 446 of Pennsylvania's 501 school districts.
Today let's focus on the relationship between school expenditures and low-SES student performance. Hardly a day goes by in which some edupundit will claim that we need more school funding to improve test scores. It's become a kneejerk reaction, especially by those slightly-left-of-center edupundits who still cling to the notion that more money can solve anything. Let's put this theory to the test.
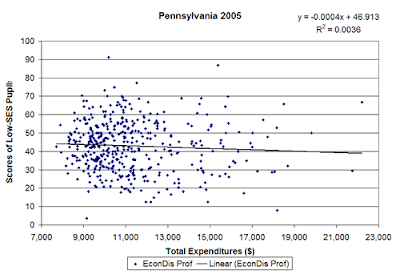
Theory One: Low-SES students perform better in schools with lots of resources. Stated differently, low-SES student achievement can be improved by providing schools with more resources. To test this theory, let's compare the performance of low-SES students on PA's state test to the total expenditures in each school district.
I also calculated:
R - The coefficient of the correlation between the score/actual data and the score predicted by the regression. For R values close to 1, there is a strong association between the variables. For R values close to zero, there is a weak association between the variables. Generally, we don't get to excited until the R values are greater than about 0.5.
R2 - the percentage of the variability in the predicted score explained by the variability in the actual data. In other words, how well does the actual data fit the predicted score. For R2 values close to one, there is a good fit. For R2 values, close to zero, there is a poor fit.
P value - If the P value is less than 0.05 we reject the null hypothesis, i.e., it is safe to assume tht the results are statistically significant.
For this regression the results are:
R = 0.06 (there is a very weak association between total school expenditures and the performance of low-SES students)
R2 = 0.0036 (there is a very poor fit between the data)
P = 0.20 (the results are not statistically significant)
I put the trend line in the graph, but there is such a poor fit between the data and the predicted score (the trend line) that the slight downward slope of the trendline is misleading.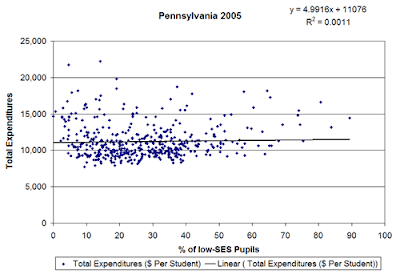
School expenditures are weakly correlated with the number of low-SES students in a district.
In case you were wondering, I also ran the regression with instructional expenditures instead of total expenditures to see if perhaps these districts with lots of low-SES students were squandering their resources on non-instructional expenses. Apparently, they aren't. The correlation between instructional expenditures and low-SES student achievement was even weaker than that for total expenditures (R = 0.03, R2 = 0.0012, and P = 0.47).
The data does not support the theory that spending more money on schools will led to improved low-SES student achievement at today's funding levels. the data suggests that even if we doubled the funding to the typical school district, we should not expect to see improved low-SES student achievement.
Of course, they make it as difficult as they possibly can to use that data, but where there's a will there's a way.
All this week I want to take a look at the performance of economically disadvantaged students and see what the data tells us. Let's see if the various bromides and theories we've been debating for the last few weeks find some support in the data.
I'm going to use the dataset for Pennsylvania 2005. It's not the most recent dataset (that would be 2007), but it is the latest dataset that includes financial and demographic data. I found data for 446 of Pennsylvania's 501 school districts.
Today let's focus on the relationship between school expenditures and low-SES student performance. Hardly a day goes by in which some edupundit will claim that we need more school funding to improve test scores. It's become a kneejerk reaction, especially by those slightly-left-of-center edupundits who still cling to the notion that more money can solve anything. Let's put this theory to the test.
Theory One: Low-SES students perform better in schools with lots of resources. Stated differently, low-SES student achievement can be improved by providing schools with more resources. To test this theory, let's compare the performance of low-SES students on PA's state test to the total expenditures in each school district.

I also calculated:
R - The coefficient of the correlation between the score/actual data and the score predicted by the regression. For R values close to 1, there is a strong association between the variables. For R values close to zero, there is a weak association between the variables. Generally, we don't get to excited until the R values are greater than about 0.5.
R2 - the percentage of the variability in the predicted score explained by the variability in the actual data. In other words, how well does the actual data fit the predicted score. For R2 values close to one, there is a good fit. For R2 values, close to zero, there is a poor fit.
P value - If the P value is less than 0.05 we reject the null hypothesis, i.e., it is safe to assume tht the results are statistically significant.
For this regression the results are:
R = 0.06 (there is a very weak association between total school expenditures and the performance of low-SES students)
R2 = 0.0036 (there is a very poor fit between the data)
P = 0.20 (the results are not statistically significant)
I put the trend line in the graph, but there is such a poor fit between the data and the predicted score (the trend line) that the slight downward slope of the trendline is misleading.
Interpretation: I calculated the average score for all PA students on a per school district basis to be 60.7 in 2005 with a standard deviation of
13.1. I also calculated the average score for low-SES students to be 43.0. this represents a large achievement gap of 1.36 standard deviation. As you can see from the graph, it didn't matter whether the school district was spending $8,000 or $19,000 per student, the performance of low-SES remained unchanged with a large amount of variation between high performing districts and low-performing districts across the board. At today's funding levels, I'd say that resources are not an issue. Especially, when you consider that, at least in PA, school districts with lots of (>50%) low-SES students are funded just as well as school districts with few (<>
13.1. I also calculated the average score for low-SES students to be 43.0. this represents a large achievement gap of 1.36 standard deviation. As you can see from the graph, it didn't matter whether the school district was spending $8,000 or $19,000 per student, the performance of low-SES remained unchanged with a large amount of variation between high performing districts and low-performing districts across the board. At today's funding levels, I'd say that resources are not an issue. Especially, when you consider that, at least in PA, school districts with lots of (>50%) low-SES students are funded just as well as school districts with few (<>
School expenditures are weakly correlated with the number of low-SES students in a district.
In case you were wondering, I also ran the regression with instructional expenditures instead of total expenditures to see if perhaps these districts with lots of low-SES students were squandering their resources on non-instructional expenses. Apparently, they aren't. The correlation between instructional expenditures and low-SES student achievement was even weaker than that for total expenditures (R = 0.03, R2 = 0.0012, and P = 0.47).
The data does not support the theory that spending more money on schools will led to improved low-SES student achievement at today's funding levels. the data suggests that even if we doubled the funding to the typical school district, we should not expect to see improved low-SES student achievement.


No comments:
Post a Comment